About Victory JS
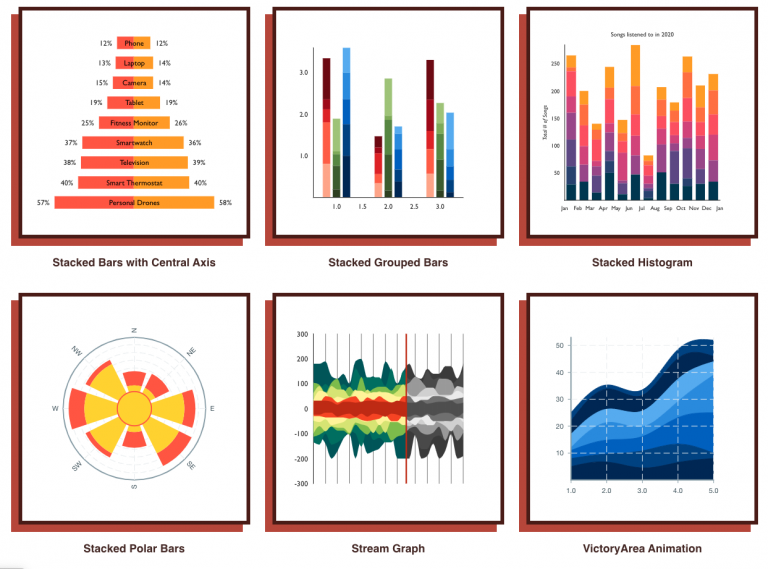
Victory JS is a set of dynamic open-source charting tools that can be used in React which is currently being managed by Lauren Eastridge. https://github.com/boygirl Samples of how VictoryJS’s capabilities can be seen at https://formidable.com/open-source/victory/gallery.
Other Options
There are many great Graphing solutions available, some might even be considered better than Victory JS. However most of the other options come with a higher learning curve and some with overwhelming amounts of information.
Of the other graphing tools, a favorite of ours is Nivo. This is a great tool for big visualization projects. This is built with D3, React and React-Motion. As tempting it looks visually, the docs by far are the most overwhelming one of all the options we considered. Nivo is a great project that comes as a scoped package, resulting in a massive learning curve. It comes with isomorphic and canvas options. Great Interface to customize.
The second option we considered is React-Vis. A great tool, built by Uber, however it was announced to be deprecated on Jan 10, and then apparently reverted on May 28th, so we’re unsure of the future of this graphing tool.Besides Victory, Recharts is something we could have considered for this particular scope of the project. It provides a lightweight composable charting library built on React Components and D3 like Victory. Most of their demo graphs seem to be coming straight out of Matlab. Since this is lightweight and fast, it might tempt developers.The last solution we considered was ChartJS. ChartJS is the only solution that is completely built off of canvas meaning no SVG. It is probably the most popular solution of all, but it does not give a composable charting React Component. However, there is a wrapper called React-chartjs-2, which currently seems to be seeking for maintainers.
Why Victory JS
After considering the above options, we ended up going with Victory JS.
Per our project requirements, all we were targeting was some kind of solution that can help create simple graphs. In our first use case, a bar graph summing hours per day, over a 7 day work week. Of course our tool needed to help us visualise data in a React Project. We were looking for an ideal solution that is fast and easy to integrate with.
Victory provided exactly what our project requirement was steering us towards in a nice, composable and ready to use React Component. Besides the API we needed to visualize the data exactly the way we wanted, Victory JS has great documentation. I am personally a huge fan of docs that provide a Quick Start Guide, and Getting Started with Victory got us going quickly.
Perusing through multiple options, we considered some decision making factors like the tool should be built off of D3 (a powerful visualization tool built off of JavaScript), it should be lightweight, it should avoid canvas graphs if possible, and straight forward to integrate.
Victory really grabbed our attention because of its well directed documentation and simplicity. Simple in the sense that it was the most straightforward solution to integrate that we came across. It gives a set of React Components where we can simply pass the data payload as props, Voila the graph is ready with many customizing and theming options.Overall Victory was a concise and precise solution for the requirements we had. With its quality technology foundations and minimal learning curve we decided to pick Victory.

Using Victory JS in a React Project
So, now you may wonder how you can incorporate Victory JS into your own project. Let us lead you through some examples.
First, how can Victory JS be incorporated into your React project?
We chose yarn as the package manager.
yarn add victory
Since the bundle itself is built by React and for React. Victory provides ready to integrate React Components which are accessible by EcmaScript 2016 `import` syntax.
Precisely, as the requirement follows we chose to import four components.
import { VictoryChart, VictoryAxis, VictoryBar, VictoryStack} from 'victory';
Victory provides composable and decoupled components. As shown in the snippet above we chose to use VictoryChart, VictoryAxis, VictoryBar and VictoryStack Component. Each serving individual responsibility.
Victory provides composable and decoupled components. As shown in the snippet above we chose to use VictoryChart, VictoryAxis, VictoryBar and VictoryStack Component. Each serving individual responsibility.
VictoryChart is a wrapper Component which provides a default axis based on the data props passed to VictoryBar Component.
VictoryBar is where we pass the data to create graphs off of. This Component accepts data in JSON format.
VictoryAxis Component gives x and y axis. It comes with three basic props namely tickValues<Array>, tickFormat<Array> and dependentAxis<Boolean> for showing values of tick, to change the format of tick and to set dependent axis respectively. If not provided VictoryChart provides a default tick axis based off of data props on VictoryBar.
VictoryStack (Not sure if we are using it anymore. I guess I remember you including for demo purposes. Similar goal can be achieve by below snippet )
<VictoryBar style={{ data: { fill: "#c43a31" } }}/>
Next, what advantages does this method of incorporation give the developer?
Gives composable React Component out of the box.
Overridable
Simplicity
With the minimalistic yet sufficient APIs provided by victory, this is by far the simplest way to create graphs with react.
Event driven visualization. May be useful for Mutation or DML.
In this project, we are only visualizing data. For example, we want a feature like changing a Bar Value. This feature can be handy to make the interface recognise the bar user has clicked on and we can mutate the value of it.
DOM manipulation should play well with Mercure.
Mercure is a message broker that comes with API Platform. Thought of including it because it will be cool to visualize real time data.. But it is not necessarily a Victory feature, it is more like a React feature. This can be fine, unincluded.
Similar Component API for React-Native project.
Easy to refer to doc if built or integrated with React-Native project.
SVG render
SVG knowledge can come handy to build and customize.
Has all basic charts
Like Bar Chart, Pie Chart, Line Chart, Histogram etc.
Customization theme using react props.
Use the existing theme with VictoryTheme as props or create custom.
Ref:
Quick Start:
How Endertech Built an Employee Time Chart
This are all the imports we used in our time chart.
import React, { useState, useEffect } from 'react';import axios from 'axios/index';import { VictoryChart, VictoryTheme, VictoryAxis, VictoryBar, VictoryLabel} from 'victory';
We used useState and useEffect to retrieve data from our API call.
const [data, setData] = useState([]);
const useStyles = makeStyles({
victoryContainer: { backgroundColor: '#ffffff' }
});
useEffect(() => {
const fetchData = async () => {
//our api needed a set boundary to for the api call
let today = new Date(Date.now());
let beforeParam = new Date(today.toLocaleString());
beforeParam = `${beforeParam.toLocaleDateString()}`;
let preformattedParam = new Date(
today.getTime() - 24 * 60 * 60 * 1000 * 6 );
preformattedParam.setHours(0);
preformattedParam.setMinutes(0);
preformattedParam.setSeconds(0);
let afterParam = `${preformattedParam.toLocaleDateString()}`;
//we finished our data formatting so now we call the api

     const result = await axios({
//getUserId() retrieves user number
//getToken() retrieves our Bearer token needed for the api call
url: `api/employee_mappings?user[]=${getUserId()}`,
baseURL: BACKEND_URL,
method: 'GET',
headers: {
Accept: 'application/json',
'Content-Type': 'application/json',
Authorization: 'Bearer ' + getToken()
} })
//take the specific property from the response
.then(data => {
const employeeId = data.data[0]['qboEmployee']['id'];
return employeeId;
})
//make another api call with the saved property
.then(data => {
const resp = axios({
url: `api/worklogs?employeeName[]=${data}&activityDate[before]=${beforeParam}&activityDate[after]=${afterParam}`,
baseURL: BACKEND_URL,
method: 'GET',
headers: {
Accept: 'application/json',
'Content-Type': 'application/json',
Authorization: 'Bearer ' + getToken()
} }).
then(response => {
console.log(response);
if (response.status == 200) {
return JSON.stringify(response.data);
} });
return resp;
});
//set the use setData we set up earlier
setData(JSON.parse(result)); };
// this function will run only on initiation
fetchData();
}, []);
The next section will handle how we modified our saved data be able to use our VictoryChart.
This is an example of how each element in data looks like.
(2) [{...}, {...}] 0: {time: "0:15", activityDate: "2020-06-05T00:00:00-07:00", updateDate: "2019-04-24T15:27:34-07:00"} 1: {time: "1:0", activityDate: "2020-06-08T00:00:00-07:00", updateDate: "2019-04-14T15:06:34-07:00"}
const oneDay = 24 * 60 * 60 * 1000;
let today = Date.now();
let todayDate = new Date(today);
let todayDateVal = todayDate.getTime();
let prevWeek = new Date(todayDate.getTime() - oneDay * 6);
 //set the start of last week at 00:00:00 time

 prevWeek.setHours(0);
prevWeek.setMinutes(0);
prevWeek.setSeconds(0);
prevWeek.setMilliseconds(0);
let prevWeekVal = prevWeek.getTime();

 let dataHold = [];
let week = {};
 //set the start of last week at 00:00:00 time
 //set each day of the week to zero
 for (let x = 0; x < 7; x++) {
//this function will change it to “3/21” date format
let thisDay = prevWeek.toLocaleDateString();
   week[thisDay] = 0;
//since we’re start from the last week just up the increase the date by one   prevWeek.setDate(prevWeek.getDate() + 1);

 }
//set the start of last week at 00:00:00 time
for (let x in data) {
let retrieved = data[x]['activityDate'];
let retrievedDate = new Date(retrieved);
let [hours, minutes] = data[x]['time'].split(':');
//in our api call we made sure our date values were within the past week
//we are free to just iterate through the data and add time wherever our
//current retrievedDate value is
week[retrievedDate.toLocaleDateString()] += parseInt(hours, 10);
week[retrievedDate.toLocaleDateString()] += parseInt(minutes) / 60;
}
let minHours = [];
// at this point we have an array of 7 days so now we just iterate them and
// push them into an array where each object has the same key
// this is important because it is how victory js will know the x and y coordinate
for (let x = 0; x < 7; x++) {
let current = Object.keys(week)[x];
let shortenedDate = current.slice(0, current.length - 5);
dataHold.push({ day: shortenedDate, time: week[Object.keys(week)[x]] });
}
Now we can look at how to insert the data into victory.
const classes = useStyles();
return (
// Container is just for styling purposes
<Container className={classes.victoryContainer}>
<VictoryChart
// domainPadding and padding are both for making the chart less cluttered
domainPadding={{ x: 15 }}
padding={30}
// style is a prop we used to change the bar to orange
style={{ data: { fill: '#FF6A00' } }}
>
// we used VictoryLabel to add Employee Hours text to the chart
<VictoryLabel
text={`Employee Hours`}
textAnchor="middle"
x={230}
y={15}
/>
// this is to let Victory know what kind of chart we will be making
<VictoryBar
// data insertion
data={dataHold}
// inside dataHold ALL object elements will have a key called day, and a key called
// time
x="day"
y="time"
// this is to display a number at the top of the bar
labels={x => x.datum.time}
style={{
labels: { fill: 'black' },
data: { fill: '#FF6A00' }
}}
></VictoryBar>
// we used this VictoryAxis to show the expected hours
<VictoryAxis
//height and offsetY is used to manipulate position of dashed axis
height={300}
offsetY={150}
// style component is used again to style VictoryAxis this time
style={{
axis: { strokeWidth: 0.3, strokeDasharray: '10 5' },
}}
tickFormat={x => "}
></VictoryAxis>
<VictoryAxis
style={{
tickLabels: {
fontSize: 14
},
axis: { strokeWidth: 0.1 }
}}
// these tickValues are default, if dataHold.key doesn’t exist 1,2,3,4 will be // displayed
tickValues={[1, 2, 3, 4]}
// take out the last 5 characters so year isn’t included// tickFormat tells us what our x axis labels will be
tickFormat={ Object.keys(week).map(e => e.slice(0 , e.length - 5 ))}
></VictoryAxis>
<VictoryAxis
// dependent is needed to denote the y axis
dependentAxis
style={{
tickLabels: {
fontSize: 14
},
axis: { strokeWidth: 0.1 }
}}// since this is what we want our y axis to look like we don’t need tickformat
tickValues={[2, 4, 6, 8, 10, 12]}
></VictoryAxis>
</VictoryChart>
</Container> );
};
This is how the end result appears.
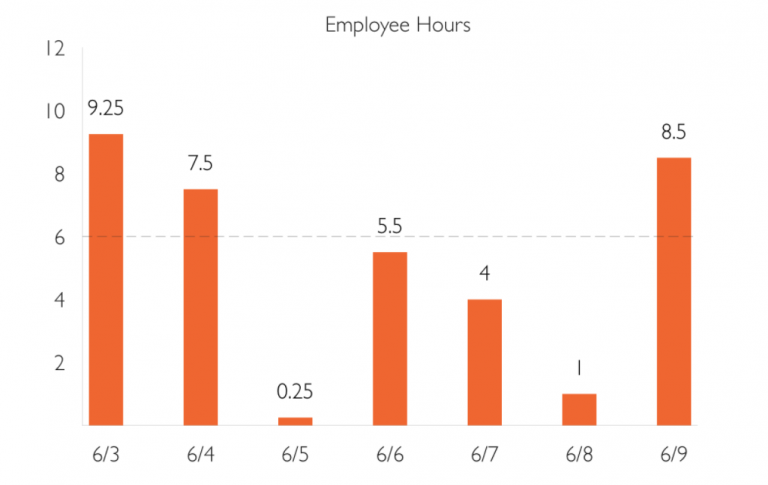
At the end of the day, we are given a customized bar graph which can be modified even further with animated bars, restyled colors, and customized fonts. This is the one of the less customized examples. More dynamic examples can be seen at https://formidable.com/open-source/victory/gallery .
—
Take from Formidable’s documentation on VictoryBar https://formidable.com/open-source/victory/docs/victory-bar
We can get a very quick scaffold of what the basic layout will be.import {VictoryChart, VictoryBar, VictoryTheme}
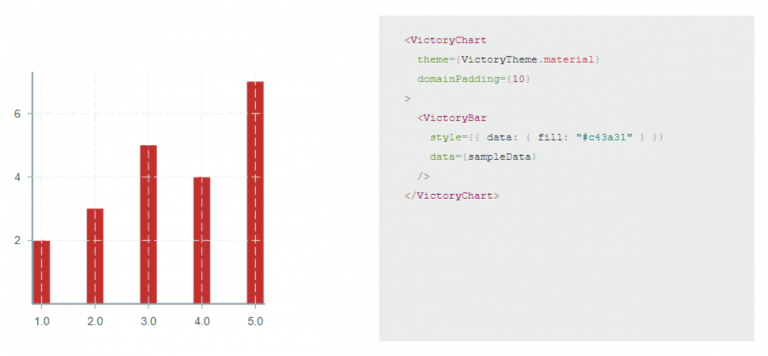
VictoryTheme isn’t necessary, but it will provide extra styles for your chat. All of these props can be edited while in Victory’s documentation. I highly suggest looking at the documentation to see how you would practically use it in a personal setting.
What you’ll be providing to the chart is sampleData. sampleData is an array of objects. Each object must have two keys that are the same for every object in the array. There are ways to manipulate this object, but this setup is all you need to get your chart up and running.